How do you measure your event’s success? As an event planner, you’re going to need to have some key performance indicators, or KPIs, which you use to measure success. There are many different event KPIs you can use to measure event performance, from simple indicators like ticket sales, to more complex equations such as projected business value.
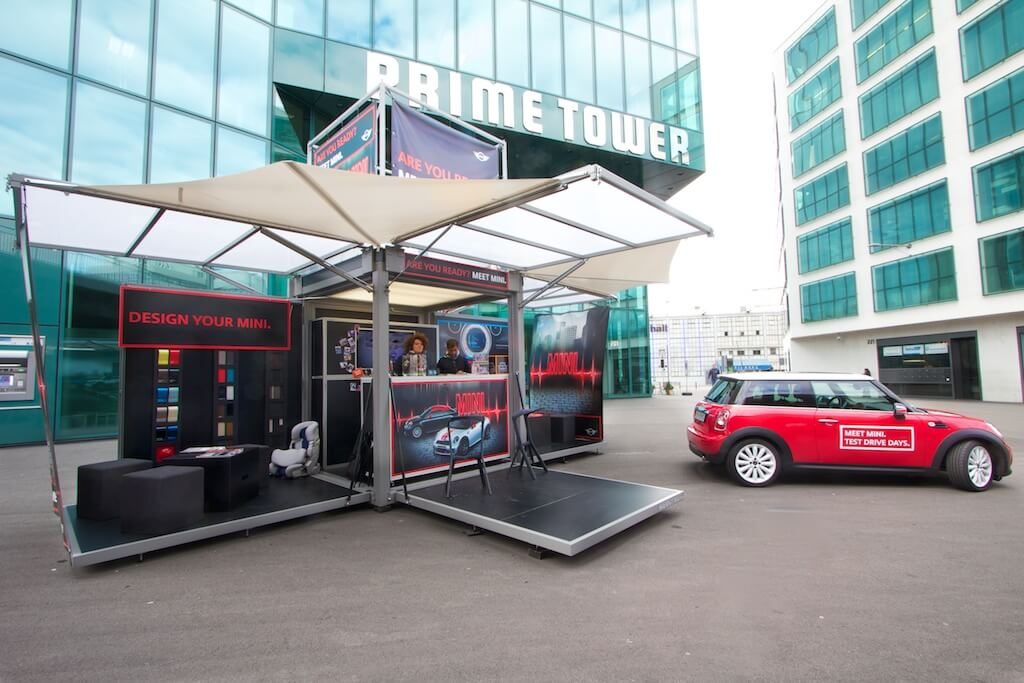
1. Registrations, Ticket Sales, & Event Attendees
In terms of hard numbers, the most fundamental for any event are attendee numbers.
- Who intends to go?
- Who buys a ticket, and when?
- Who actually ends up attending?
- If your company regularly holds events, how many attendees have been to a previous event?
These figures are useful both in the lead-up to an event, and after it’s over. For a completed event, ticket sales are part of several important KPIs, including revenue and ROI.
In the event lead-up, ticket sales and event registration can give you useful information about how successful your marketing efforts are. It’s also useful to look at when people are buying tickets. Are most people taking advantage of early bird pricing, or leaving it until the last minute? How many people buy tickets on the day? You might also experiment with different ticket types and ticket pricing (VIP, audio-only, etc.), so you can see which tickets sell best.
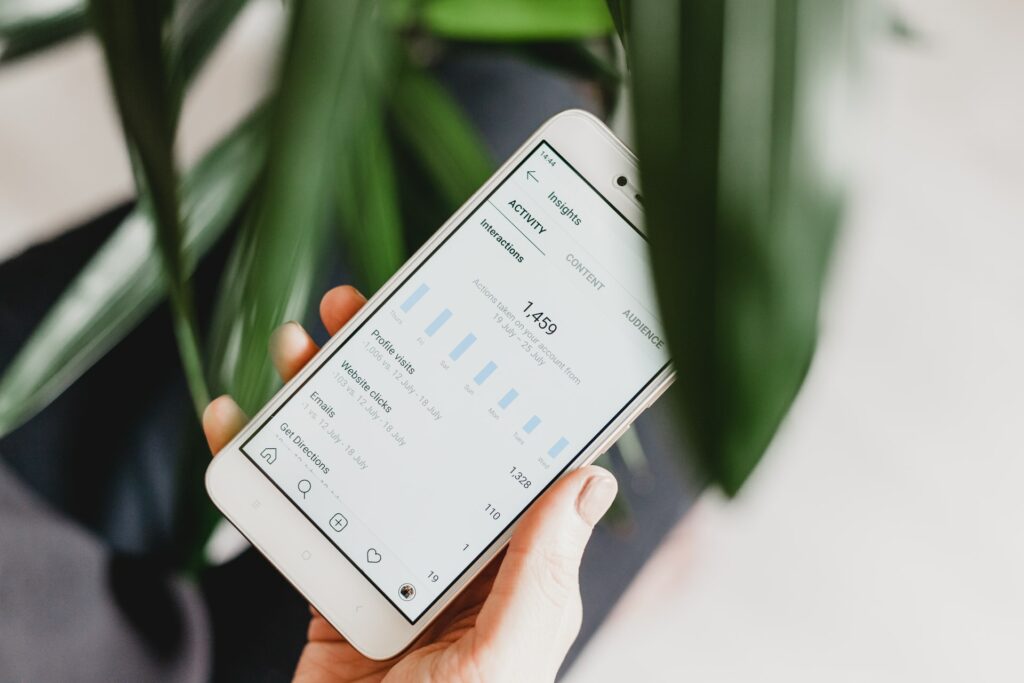
2. Social Media Metrics
Monitoring social media engagement before, during, and after the event can provide useful metrics and clues as to how much interest it’s generating. If your social media content is generating plenty of interest with your target audience, that’s a great indication that you’re on the right track.
- Keep track of what kinds of content people most respond to and adjust your pre-event marketing efforts to increase your reach.
- During the event, high levels of social media engagement, such as social media mentions or use of your event hashtag, help keep motivation and interest high. Event check-ins are another great social media interaction to keep track of.
- The longer you can keep that buzz going after the event, the longer you can continue to benefit from higher visibility.
3. Event Interactions and Attendee Engagement
After the event is over, metrics such as ROI will help you determine if the event has been a financial success. But that data doesn’t necessarily tell you why it was successful. For that you need to look at what attendees do during the event, and how engaged they are with the event. The more engaged attendees are, in general, the better the event is. Audience engagement is typically measured by looking at interaction figures.
Note: If you’re hosting a virtual event or hybrid event, you will likely have extra data on engagement for the virtual portion, such as online chat or other online engagements. Depending on your virtual event platform, you will likely have more data sources.
For any interactive features at the event, how many people actually use them? For instance:
- How many people download the event app?
- Of those who download it, how many use each of its main features?
- How many attend keynote speeches, panel discussions, and other presentations?
- How many people visit sponsored booths or exhibits?
- How many use interactive features such as LED floor maps or presentations?
4. Net Promoter Score
The net promoter score (NPS) is one of the most important event metrics that companies look to when they want to know what their customer base really thinks about them. NPS is essentially a measurement of customer loyalty. It typically involves asking respondents how likely they are to recommend the product or company to others.
NPS is a useful metric for most marketers to track, and it’s especially helpful in the events industry. For many companies, the long-term objective of an event isn’t revenue, it’s something less tangible, such as brand recognition or thought leadership—and NPS helps measure the success of those kinds of goals.
In addition, while NPS isn’t a sales-driven event metric, research does show that NPS and ROI have a strong association, making it even more useful. That’s why any events marketer should track the NPS.
How to calculate NPS
Simple event surveys can provide fantastic data. NPS is based on the answer to just one question: “How likely are you to recommend our brand/product to colleagues/friends/others?”
Respondents give their answers on a scale that numbers from 0 to 10:
- 9-10 are positive scores (likely to recommend)
- 7-8 are neutral or passive scores
- 0-6 are negative (these people are considered detractors)
NPS is then calculated as the number of promoters minus detractors, divided by the total respondents. This figure is then multiplied by 100 to get the final score. Obviously this number can be greatly influenced by the attendee’s event experience.
Scores range from -100 (all detractors) to +100 (all promoters). Benchmark scores vary widely between different industries, however. A score of 40 might put the company ahead in one industry, but put it behind the pack in another.
NPS isn’t only about comparisons to other companies, of course. It’s also extremely useful for companies to track their own NPS over time and examine how it’s influenced by product launches, industry news, and other activities—such as hosting events.
5. Return on Investment
One of the most important tools for measuring the success of your event is also one of the most challenging to calculate. Return on investment (ROI) is a measurement of the direct return of a trade show, relative to its overall cost. It’s of prime importance when your event objectives are focused on increasing revenue or sales. It’s still useful even when your objectives are less tangible—but the less tangible or more long-term your event goals are, the harder ROI is to pin down accurately.
How to calculate ROI
ROI is a simple equation: it’s revenue minus costs, divided by costs, then multiplied by 100 to express as a percentage. If the final result is a positive number, it represents a positive return on investment. If it’s a negative number, it means the event incurred a net loss.
The difficulty in calculating ROI is that some forms of revenue can’t be easily quantified. Brand recognition, brand loyalty, industry influence, or social media clout aren’t things you can measure in the short term, but over months and years they can exert a strong effect on a company’s bottom line. When calculating ROI, therefore, it’s always important to remember that it’s not the whole story, especially when your event objectives aren’t directly tied to revenue or sales. Measuring event success can’t be reduced to a single number!
6. Close Rate
If your event is aimed at generating qualified leads that result in purchases, then tracking the close rate is a must. This event metric is a percentage representation of how many qualified leads end up making purchases. As such, it’s not always a metric you can calculate immediately after an event. In some situations, it may be that your close rate can’t be calculated until your next sales cycle is complete.
How to calculate the Close Rate
The close rate is simply the total number of sales, divided by the number of qualified leads. Multiply by 100 to express as a percentage.
Tracking close rate is useful for several reasons. Most importantly, it lets you evaluate how good your lead-gathering system is. It can also help you determine more accurately an event’s overall value, by giving you an additional metric to track alongside ROI and NPS.
7. Cost Per Lead & Cost Per Qualified Lead
Cost per lead (CPL) is an event metric that measures the cost of generating individual sales leads. But it’s somewhat limited, in that it doesn’t distinguish the quality of leads that go into determining the total CPL. Cost per qualified lead (CPQL) is an additional event KPI that’s more accurate than CPL in determining exactly what each legitimate lead costs.
These numbers are especially useful for events that are focused on customer acquisition. If you know the value of your leads, then it’s important to find out the cost of each lead is worth it.
How to calculate CPL/CPQL
Both metrics are calculated in the same way, but using slightly different data sets. For each, simply divide your total show investment figure by the number of leads or qualified leads the event generates. The final product is your CPL or CPQL.

8. Estimated Revenue
Revenue is a difficult event KPI to track, because it may encompass more than just ticket sales. In some cases, revenue may include long-term sales leads, which won’t be quantifiable until the next sales cycle is well under way. That could mean months, or in some cases, years. After all that time it may be difficult, if not impossible, to determine whether specific sales are directly or indirectly related to an event from several years ago.
Estimated revenue attempts to bridge this gap by using past event averages to estimate revenue for the current event. Of course, this means calculating ER relies on having the results from previous events to consider. So, it’s not an event metric you can rely on for the first few events. But once you are able to calculate this KPI, it’s a useful way of getting a quick revenue estimate after the event.
How to calculate Estimated Revenue
ER is the number of leads, multiplied by the close rate, multiplied by the average value of a sale or contract. This gives you an estimate of the revenue you can expect to gain from long-term leads. You can then use ER in calculating event ROI and other event metrics as well.
9. Projected Business Value
This alternative to return on investment helps address some of the difficulties in calculating the ROI for an event. Projected business value (PBV) is a projection of how much value an event provides. It’s a good option for companies with long sales cycles, and for events where upselling is included as a long-term goal. PBV calculates how much value an event is likely to bring in the long-term, in comparison to alternative value-generating methods.
How to calculate PBV
To determine PBV, you need three data sets:
- Number of qualified leads (QL) – qualified leads generated from an event
- Average historical close rate (CR) – the percentage of qualified leads that result in sales
- Added business value (BV) – the average difference in value between clients who attend an event, and clients who don’t
To find the PBV, simply multiply BV x QL x CR. The final result is a prediction of how much value you obtained from the event that wouldn’t otherwise have been generated.
We’ll do your post-event analysis.
Monitoring Event KPIs Leads to Greater Event Success
Events can generate huge amounts of data, which can be overwhelming to deal with—especially for companies and event managers that are new to event planning. By focusing on key event metrics, it quickly becomes much easier to deal with that data, and to actually measure event success. Once you’ve developed a useful set of event KPIs, it’s also important to continue measuring them, year after year, at event after event. Over time, you’ll be able to detect trends and patterns that will help you improve your events and gain even more benefit from them.